

1. Introduction
2. Materials and Experimental Procedure
2.1. Raw materials
2.2. Preparation process
2.3. Characterization
3. Results and Discussion
3.1. AG - Fibrous Porous Ceramics
3.2. AGG - Fibrous Porous Ceramics
3.3. Filtering characteristics of AG - Fibrous Porous Ceramics and AGG - Fibrous Porous Ceramics
4. Conclusions
1. Introduction
Fibrous porous ceramics (FPC) refers to a porous material prepared with ceramic fibers and high temperature binder as raw materials. FPCs have the advantages of being lightweight, high porosity, large specific surface area and good heat insulation,1,2) they are broadly applicable to thermal insulating materials,3,4,5) filtration and separation materials,6,7,8) catalyst support materials,9,10,11) adsorption materials,12,13) and so on. The preparation methods of FPCs mainly include freeze-drying,14,15) gel-casting,16,17) press filtration,18,19) and vacuum suction filtration.20,21)
Zhang et al.4) prepared mullite fibrous porous ceramics with a “wall-septa” structure through freeze-drying process, which exhibited excellent high-temperature mechanical properties. Jia et al.17) used silica sol as binder and epoxy propane as gelation promoter to facilitate the solidification of silica sol, successfully preparing mullite fibrous porous ceramics with the nest-like structure via the gel-casting process. However, the above two methods have problems such as complex process flow and high preparation cost. Zhou et al.19) prepared silica fibrous porous ceramics with perfect interlayer bonding by the press filtration process, which exhibited superior compression and resilience under a strain of 20 %. Dong et al.20) prepared mullite fibrous porous ceramics by the vacuum suction filtration process using mullite fiber and boron-modified silica as the main raw materials. However, during the drying process, the uneven distribution of the structure occurred due to the migration of silica sol onto the surface of the samples. Zhu et al.22) replaced silica sol with polysiloxane as binder and used its rapid cross-linking reaction during the drying process to successfully produce homogeneous mullite fibrous porous ceramics by the vacuum suction filtration process.
In this study, aluminosilicate fibrous porous ceramics were prepared through vacuum suction filtration. The effects of the sintering process on the phase composition, microstructure and properties of the porous ceramics have been investigated.
2. Materials and Experimental Procedure
2.1. Raw materials
Aluminosilicate fiber (ASF, Zhejiang Deqingleijing Crystal Fiber Co., Ltd., China), glass fiber (GF, Shanghai Chenqi Chemical Technology Co., Ltd., China), and glass powder (GP, Jiangsu Colorful-Mineral Co., Ltd., China) were the main raw materials. The microscopic morphology of ASF and GF is shown in Fig. 1. The primary components of ASF are SiO2 and Al2O3, which are listed in Table 1 for analysis results. Carboxymethyl cellulose (CMC, Shanghai Macklin Biochemical Co., Ltd., China) was selected as dispersant, while glass powder (GP, Jiangsu Colorful-Mineral Co., Ltd., China) acted as high-temperature binder and polyacrylamide (PAM, Shanghai Macklin Biochemical Co., Ltd., China) was used as normal-temperature binder.

Table 1.
Chemical composition of aluminosilicate fiber.
| Composition | SiO2 | Al2O3 | Na2O | CaO | Fe2O3 |
| Content (wt%) | 60.25 | 36.97 | 0.41 | 0.29 | 0.16 |
2.2. Preparation process
In this paper, we have prepared two kinds of aluminosilicate fibrous porous ceramic samples. Fibrous porous ceramic samples prepared with aluminosilicate fiber and glass powder are called AG-FPCs, and the samples prepared with aluminosilicate fiber, glass fiber and glass powder are called AGG-FPCs. The aluminosilicate fiber (or mixed glass fiber) was dispersed in carboxymethyl cellulose aqueous solution (0.5 wt%), then glass powder (GP) and polyacrylamide (PAM) were added, and stirred evenly to obtain fiber slurry. The fiber slurry was poured into a mold, and the green bodies were obtained by the vacuum suction filtration process. Finally, the green bodies were dried at 70 °C for 6 h and sintered in a high-temperature furnace at the predetermined temperature for 2 h with the heating rate of 3 °C/min. The ingredient compositions of AG-FPC and AGG-FPC are presented in Table 2.
Table 2.
The ingredient composition of AG-FPC and AGG-FPC.
2.3. Characterization
Microstructures of the samples were observed through a scanning electron microscope (SEM, Gemini SEM 500). Phase compositions of the samples were analyzed via X-ray diffractometer (XRD, Bruker D8-ADVANCE) equipped with Cu Kα radiation (λ = 1.5406 Å), tube voltage of 40 kV, tube current of 30 mA. The bulk densities of the samples were characterized by Archimedes’ drainage method. The open porosities of the samples were measured by the Archimedes method. The diameters of the samples were measured via a vernier caliper before and after the samples were sintered, and the linear shrinkages of the sintered samples were calculated based on the changes of diameter. Thermal conductivities of the samples were measured through the thermal conductivity instrument (TC-3000, Shanghai, China). The cross sections of the samples were observed and photographed through the stereomicroscope (XTL-30C, Shanghai, China), and the image analysis software Image J was used to obtain the pore size distribution and the average pore size. The permeability measurement followed the national standard (GB/T 1969-1996),23) and the pressure drop measurements of the samples were measured via a pressure differential meter (GM-510, Guangdong, China) in the filtration test. The compressive strength tests of the samples were performed through an electronic universal testing machine (REGER RGM-6010, Shenzhen, China) in accordance with GB/T 1964-1996 at a loading speed of 0.05 mm/min.24)
3. Results and Discussion
3.1. AG - Fibrous Porous Ceramics
3.1.1. Phase composition of the samples
The XRD patterns of AG-FPCs with 20 wt% glass powder are shown in Fig. 2. The XRD pattern of the green body clearly shows the presence of a broad peak, indicating the existence of abundant amorphous components in the sample. After being sintered at 900 °C, not only were amorphous components present, but mullite and cristobalite phases also existed in the sample. This is because the aluminosilicate fiber used is an amorphous ceramic fiber that undergoes crystallization above 900 °C, resulting in the formation of mullite and cristobalite crystals.25) The response equation is given by Eq. (1).
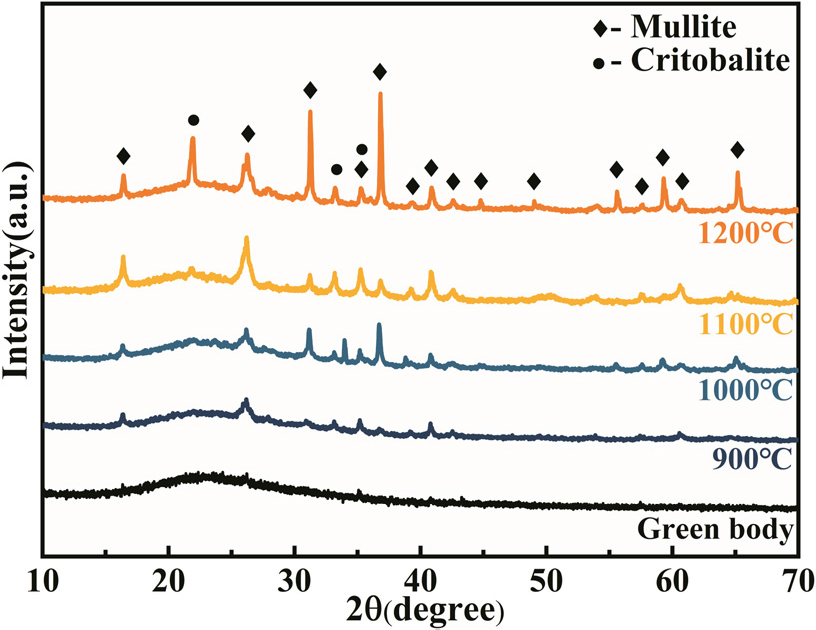
With the increase of sintering temperature, the intensity of mullite diffraction peaks and cristobalite diffraction peaks gradually increases. The precipitation of cristobalite causes more significant structural damage to the aluminosilicate fiber compared to mullite, which is related to the crystallographic transformation of cristobalite during the cooling process.26,27)
3.1.2. Microstructure of the samples
The SEM micrographs of the AG-FPCs sintered at 1,000 °C are shown in Fig. 3. With the addition of glass powder, the fibrous skeleton gradually becomes compact and the pore size of the sample decreases constantly. When the content of glass powder is low, there are only a small amount of binder phase presented in the fibrous skeleton and the pore size distribution of the sample ranges between 6.97 µm and 15.28 µm. The average pore size of the sample is 8.26 µm. When the content of glass powder reaches 20 wt%, the binder phase wraps around the fiber overlap region [Fig. 3(b)], resulting in improved bonding between fibers, and the pore size distribution of the sample ranges between 3.96 µm and 12.42 µm. The average pore size of the sample is 7.88 µm. As the content of glass powder continues to increase, the binder phase continuously accumulates at fiber overlap regions [Fig. 3(c, d)], resulting in an enhanced constraint on the fibrous skeleton and gradual shrinkage of it. When the content of glass powder reaches 40 wt%, the pore size distribution of the sample ranges between 2.49 µm and 9.15 µm, and the average pore size of the sample is 6.95 µm. At this point, the binder phase exhibits an overly bonded state.17)

3.1.3. Physical and mechanical properties of the samples
Fig. 4 shows the physical and mechanical properties of AG-FPCs sintered at 1,000 °C. With the increase in the content of glass powder, the linear shrinkage and thermal conductivity of the samples increase slowly, both the bulk density and compressive strength gradually increase, and the open porosity gradually decreases. As shown in Fig. 4(b, c), When the content of glass powder reaches 20 wt%, the sample exhibits a compressive strength of 0.63 MPa with an open porosity of 89.08 %. At this point, the binder phase forms spherical shapes that wrap around fiber overlaps, exerting a strong constraint on the fibrous skeleton [Fig. 3(b)]. When the content of glass powder increases to 40 wt%, the compressive strength of the samples increases to 0.87 MPa and the open porosity decreases to 86.17 %, while the maximum linear shrinkage of the sample is 1.74 %. At this point, the binder phase aggregates into blocks at fiber overlap points and grow outward. Gradually, excessive amounts of binder phase fill the pores of the samples [Fig. 3(c, d)], further enhancing their constraint on fibrous skeleton. Moreover, it could be found that the thermal conductivity of all the sintered samples were lower than 0.05 W/(m ‧ K).

3.1.4. Compression and physical properties of the samples
The stress transmission characteristics of aluminosilicate fibrous porous ceramics differ from those observed in traditional porous ceramics due to their distinctive fibrous network structure.26) The compressive stress-strain curve of the AG-FPCs undergoes three stages, elastic stage, plateau stage, and compression stage.24) In particular, the compressive strength is defined as the maximum stress of the sample in the elastic stage.28)
Fig. 5 shows the compression and physical properties of AG-FPCs with 20 wt% glass powder. After being sintered at 1,000 °C, as shown in Fig. 5(a), during the elastic stage (strain ε < 5.3 %), a linear proportional relationship between stress and strain is observed, with sample deformation primarily resulting from fiber bending and twisting of the fibrous skeleton. In addition, it is worth noting that the deformation can be fully recovered after unloading.24) In the platform stage strain 5.3 % < ε < 5.7 %), the load is continuously transferred to the fiber nodes, leading to a gradual fracture of the fibrous skeleton over time.29) At this point, the stress remains constant and removing of the load does not restore the deformation. During the compression stage (strain ε > 5.7 %), as the applied strain increases, stress gradually amplifies, leading to cracks in the binder phase at the fiber nodes and subsequent gradual collapse of the fibrous skeleton structure.30) Based on Fig. 5(b), it is evident that there is an increase in the compressive strength of samples from 0.63 MPa to 1.37 MPa, and the open porosity decreases from 89.08 % to 82.38 %. As we all know, the compressive strength of fibrous porous ceramics is influenced by both the properties of binder and fiber,7) the bonding force between the binder phase and fibers is enhanced by increasing the sintering temperature, which is beneficial for material strength improvement. However, high sintering temperatures can lead to structural damage and property degradation of aluminosilicate fibers, which is also in agreement with the XRD analysis shown in Fig. 2. This can impede further enhancement of material strength.

3.2. AGG - Fibrous Porous Ceramics
3.2.1. Phase composition of the samples
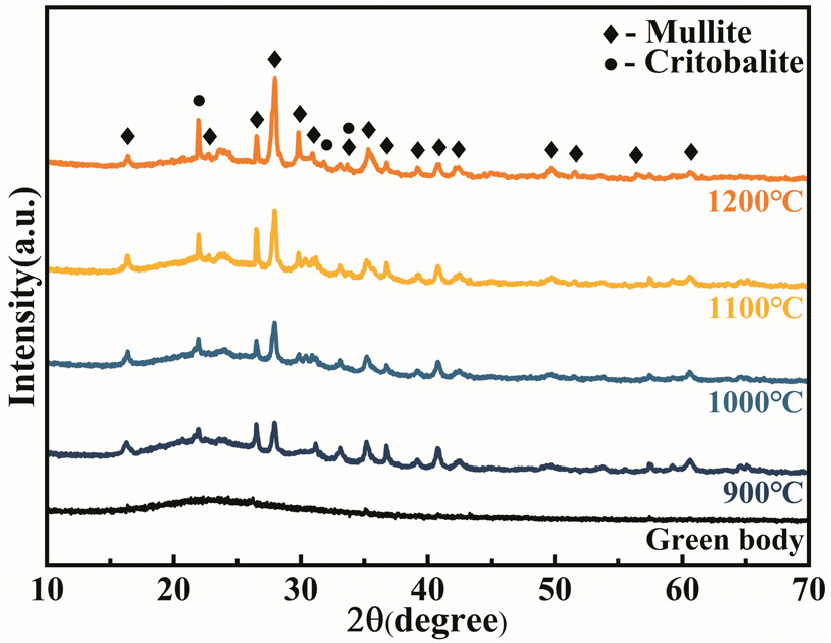
The XRD patterns of AGG-FPCs with 30 wt% glass fiber are shown in Fig. 6. The XRD pattern of the green body clearly indicates the presence of a broad peak, suggesting the existence of abundant amorphous components in the sample. After being sintered at 900 °C, the XRD pattern of the sample exhibits the diffraction peaks corresponding to mullite and cristobalite. With the increase of sintering temperature, there is a gradual enhancement in the intensity of diffraction peaks for both mullite and cristobalite. Comparing the XRD patterns of AG-FPCs (Fig. 2), it is evident that the incorporation of glass fiber does not affect the phase compositions of AGG-FPCs.
3.2.2. Microstructure of the samples
The SEM micrographs of the AGG-FPCs sintered at 1,000 °C are shown in Fig. 7. With the increase in the content of glass fiber, the pore size of the samples is initially decreases and subsequently increased. When the content of glass fiber reaches 30 wt%, the binder phase effectively bonds the overlapping fibers [Fig. 7(c)]. Meanwhile, the pore size distribution of the sample ranges between 4.38 µm and 10.01 µm, and the average pore size of the sample is 8.51 µm. However, when the content of glass fiber reaches 40 wt%, there are a more loosely arranged fibrous skeleton [Fig. 7(d)]. The pore size distribution of the sample ranges between 3.41 µm and 13.86 µm, and the average pore size of the sample is 10.47 µm. Therefore, the above situation indicates that forming an ideal fiber network structure becomes a challenge when the relative content of aluminosilicate fibers is low.31)

3.2.3. Physical and mechanical properties of the samples
Fig. 8 shows the physical and mechanical properties of AGG-FPCs sintered at 1,000 °C. With the increase in the content of glass fiber from 0 wt% to 40 wt%, the linear shrinkage of the samples gradually increases, the compressive strength exhibits an upward trend, and the bulk density initially decreases and then subsequently increases. Meanwhile, the open porosity of the samples initially increases, followed by a subsequent decrease, and the thermal conductivity increase slowly. As shown in Fig. 8(b, c), when the content of glass fiber is 0 wt%, the sample exhibits a compressive strength of 0.63 MPa and an open porosity of 89.08 %. In general, there is the Rice equation that relates the compressive strength and porosity of a porous material,32,33) which is given by Eq. (2).
where, E0 is the compressive strength at zero porosity, b reflects the form factor of the pores and P is the volume fraction of porosity. Specifically, when the content of glass fiber reaches 10 wt%, the sample exhibits a compressive strength of 1.10 MPa and an open porosity of 91.02 %, with the linear shrinkage of 1.74 %. At this point, the binder phase primarily distributes at the overlap of fibers [Fig. 7(a)], without filling in pores of the fibrous skeleton. When the content of glass fiber increases to 30 wt%, the compressive strength of the sample increases to 1.34 MPa, the open porosity decreases to 89.56 %, and the linear shrinkage increases to 5.26 %. At this stage, a strong bond is established between the binder phase and fibers, leading to gradual contraction of the fibrous skeleton [Fig. 7(c)]. The thermal conductivity of the sample increases progressively with higher fiber content, which is closely related to the intrinsic thermal conductivity properties of the fiber.17) Based on the above analysis, glass fibers not only facilitate the formation of well-connected fibrous network structures of AGG-FPCs, but also enhance their mechanical properties. However, as the content of glass fibers exceeds 30 wt%, the open porosity of the samples decreases sharply. Therefore, it is suggested that the optimal content of glass fibers should be 30 wt%.

3.2.4. Compression and physical properties of the samples
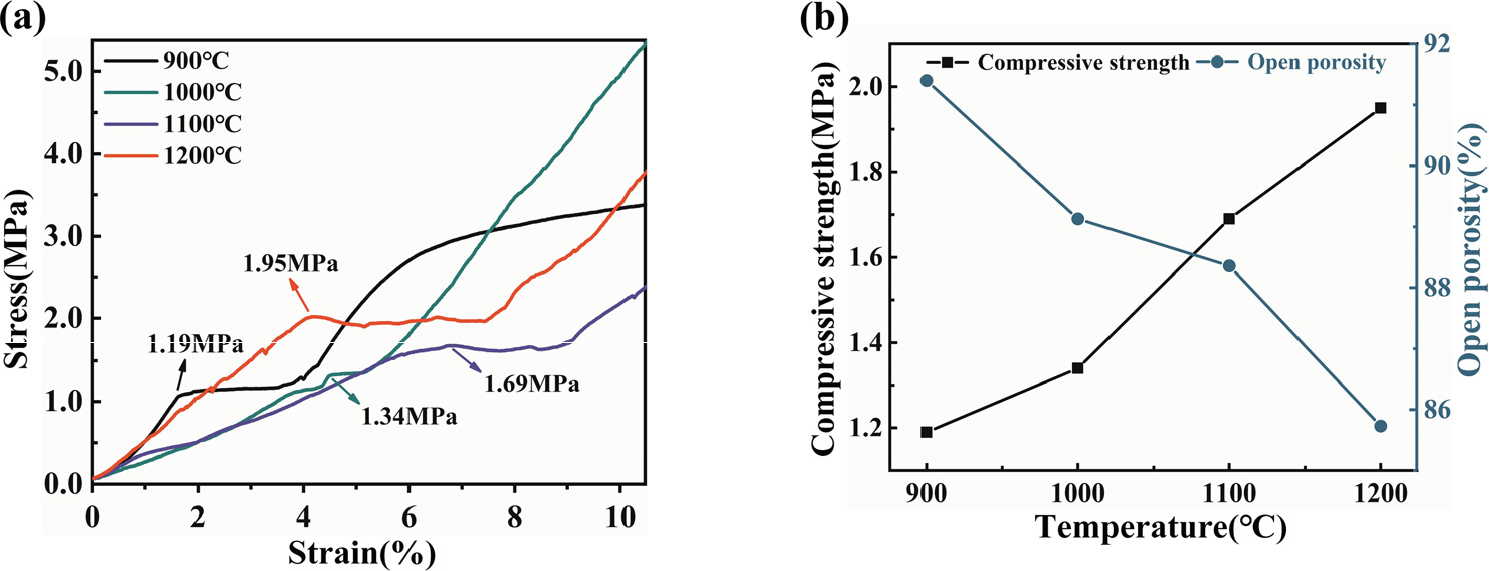
Fig. 9 shows the compression and physical properties of AGG-FPCs with 30 wt% glass fibers. As shown in Fig. 9(a), with the increase of sintering temperature, the yield strain of the samples initially increases and then decreases, while its compressive strength gradually increases. After being sintered at 900 °C, the sample yields at a strain of ε = 1.7 %, with a compressive strength of 1.19 MPa. However, without the addition of glass fiber (Fig. 5), the compressive strength of AG-FPCs is only 0.32 MPa, this indicates that the addition of glass fiber significantly enhances the material’s strength. After being sintered at 1,000 °C, the sample yields at a strain of ε = 4.5 %, with a compressive strength of 1.34 MPa. By combining with Fig. 9(b), it can be observed that as the sintering temperature increases from 1,000 °C to 1,200 °C, the compressive strength of the samples increases from 1.34 MPa to 1.95 MPa, whereas the open porosity decreases from 89.13 % to 85.73 %. This is due to that glass fibers act as binder phase at high temperatures by melting, thereby enhancing the compressive performance of the sample.31,34) However, the strength of the aluminosilicate fibers decreases continuously at elevated temperatures, which hinders further improvement in material strength. This is also in agreement with the XRD analysis shown in Fig. 6. Therefore, the addition of a moderate amount of glass fiber could enhance the compression and physical properties of the sample and broaden the potential applications of aluminosilicate fibrous porous ceramics.
3.3. Filtering characteristics of AG - Fibrous Porous Ceramics and AGG - Fibrous Porous Ceramics
Fig. 10 shows the comparison of filtration performance between AG-FPC and AGG-FPC. Firstly, pressure drop and permeability are two crucial parameters for evaluating the filtration performance of porous materials, and the pressure drop refers to the difference in pressure generated on either side of the filter element due to energy loss during fluid passage.35)
As shown in Fig. 10(a), the trends of the pressure drop are similar for AG-FPC and AGG-FPC with different filter flow rates. As the filter flow rate increases, there is a gradual increase in pressure drop for the sample. When the filtration flow rate exceeds 150 mL/min, AGG-FPC exhibits a lower filter pressure drop of 0.56 KPa. The permeability rates of both AG-FPC and AGG-FPC, show in Fig. 10(b), initially measure 1.15 × 10⁻⁶ m2 and 1.13 × 10⁻⁶ m2 respectively. As filtration progresses, the permeability of the sample tends to reach a plateau, AGG-FPC maintains a consistently high rate of 0.77 × 10⁻⁶ m2 while AG-FPC exhibits a slightly lower rate of 0.63 × 10⁻⁶ m2, which is consistent with previous research.36,37) This indicates that the excellent filtration performance of the AGG-FPC is attributed to its high porosity and well-developed fibrous skeleton structure.

4. Conclusions
In this study, vacuum suction filtration was used to fabricate two types of aluminosilicate fibrous ceramics, and the effects of raw material composition and sintering process on the structure and properties of these materials were investigated. The following conclusions were drawn.
(1) With the increase of sintering temperature, the bond between binder phase and fibers gradually strengthens, thus the mechanical properties of materials are improved. When the sintering temperature reaches 900 °C, mullite and cristobalite phases begin to appear in the samples. However, an excessive increase in sintering temperature results in a significant production of cristobalite, which negatively impacts the properties of aluminosilicate fiber and hinders further improvement of sample strength.
(2) When the content of glass powder was 20 wt%, the binder phase formed a spherical shape that encapsulated the overlapping area of fibers after being sintered at 1,000 °C, creating a strong bond between the binder phase and fibers. At this point, the sample exhibits a compressive strength of 0.63 MPa and an open porosity of 89.08 %. With the increase in the content of glass powder, excessive binder phase fills the pores in the fibrous skeleton, resulting in an enhanced bond strength between the binder phase and fibers. However, when the content of glass powder reaches 40 wt%, overbending of binder phase occurs during the sintering process, resulting in a compressive strength of 0.87 MPa and an open porosity of 86.17 %.
(3) Due to the melting of glass fibers, which act as a binder phase at high sintering temperatures, the strength of the sample improves. However, it becomes difficult to form an ideal fibrous network structure when the content of glass fibers is high. With the content of glass fiber increases to 40 wt%, the compressive strength of the sample gradually increases to 1.53 MPa, and the open porosity slightly decreases to 89.13 %. The pore sizes distribution of the sample ranges between 3.41 µm and 13.86 µm, and the average size is 10.47 µm.
(4) The exceptional permeability performance of the aluminosilicate fibrous porous ceramic samples can be attributed to their high porosity and interconnected three-dimensional pore structures. When the filtration flow rate reaches 150 mL/min, the pressure drop of the sample is 0.56 KPa and the permeability is 0.77 × 10⁻⁶ m2.
