

1. Introduction
2. Experimental Procedure
3. Results and Discussion
3.1. Structural characteristics
3.2. The electrical characteristics
3.3. Microscopic results of atomic forces
4. Conclusion
1. Introduction
One of the phenomena that has enhanced the study of materials is known as superconductivity, which refers to the ability of some metals, alloys, and varieties of ceramics to conduct electricity without resistance at very low temperatures.1,2) Since the two scientists Ochsenfeld, and Meissner discovered superconductivity phenomena in 1933, this phenomenon has drawn the attention of other scholars.3,4) In addition to having no resistance, superconductors also can eject magnetic fields from within themselves while transitioning from a normal state to a superconducting state. The superconductors have become useful through two distinct characteristics, namely the lack of electrical resistance and the expelling of the magnetic field outside the material. The research sought to develop superconductors with a temperature higher than the boiling point of nitrogen 77 K, because the critical temperature for superconductivity was very low and required helium liquid (4.2 K) for cooling, making it expensive to achieve and maintain these low temperatures.5,6) High-temperature superconductors, a class of ceramic materials with a critical temperature higher than 90 K, were discovered in 1986, ushering in a new era for superconductors. Due to the findings, liquid nitrogen could now be used, which was of tremendous significance to cooling.6) As cooled liquid nitrogen boils at 77 K and has an affordable price, the discovery of this material has made numerous experiments and applications possible. However, research is still being done to find superconducting materials with higher critical temperatures so that there are more applications possible. Superconductivity was originally observed in the oxides of Before (Sleight) in 1975. Specifically, he found that the BaPb1-xBixO3 compound has a critical temperature of 13 K when x = 0.25.7)
Two -superconducting copper oxide layers, which are insulating layers that can serve as electron-active charge repositories for the hole- or electron-donating layers of copper and oxygen, make up the crystal structures of mercury-based superconductors.8,9) By removing the oxygen overlap between the Cu-O levels, it is possible to think of the Cu-O layers as deriving from the perovskite structure, whilst the rock salt structure is the source of the dielectric layer.10,11,12) This current work discusses the temperature-dependent electrical characteristics and structural properties of the Hg1-xPbxBa2Ca1.8Mg0.2Cu3O8+δ samples and at concentrations x = 0. 0, 0.05, 0.10 and 0.20.
2. Experimental Procedure
By using the molecular weights of Nanomaterials (of pure powders (99.998 % from May & Baker LTD Dagenham England) HgO, PbO, BaO, CaO, MgO and CuO) about the weight of the element in each of the constituent parts of the compound to be manufactured, weight ratios for the components that contributed to the production of the Hg1-xPbxBa2Ca1.8Mg0.2Cu3O8+δ compound (with Lead concentrations x = 0. 0, 0.05, 0.10 and 0.20) were computed. The weights of the oxides are mixed, these materials are placed into a get mortar, and then these materials are finely ground using a grinder pestle and mortar material for 30 minutes. With the addition of an isopropanol solution during the grinding process, to prevent falling or losing parts of the powder during the grinding process, the isopropanol alcohol is then removed by placing it in an electric oven at a temperature of 373 K. The powder is then formed into tablets with a diameter of 12 mm and a thickness of 3 mm under pressure of 8 tons per square centimeter. These discs are put in an electric furnace and heated to a temperature of 1,138 K at a heating rate of 120 K per h. After being heated at this temperature for 48 h, the temperature is then progressively lowered at a rate of 30 K per h) until it reaches room temperature, at which point the furnace temperature is increased to 973 K at a rate of (120 K/h), staying at this temperature for 12 h in an oxygen-rich environment. Finally, the sample temperature is lowered to room temperature with a cooling rate of 60 (K/h). The crystal structure and the impact of mercury’s partial substitutionally with lead (x) on the Hg1-xPbxBa2Ca1.8Mg0.2Cu3O8+δ compounds were examined using x-ray diffraction and AFM test type (Philips). The electrical properties were examined as a function of temperature (measured by a Nano voltmeter and Ammeters were used for voltage and current measurements) to calculate the value of the critical temperature (Tc) for the samples and to determine the extent to which partial substitutional on these samples effective the value of the critical temperature (Tc).
3. Results and Discussion
3.1. Structural characteristics
Various ratios of (x) as the value of x = 0.0, 0.05, 0.10, and 0.20 were used to study the structural characteristics of the combination Hg1-xPbxBa2Ca1.8Mg0.2Cu3O8+δ samples, as shown in Fig. 1, under sintering temperature (1,138 K) conditions and pressure (8 ton/cm2. These samples’ X-ray diffraction study revealed varied ratios of X values. As demonstrated in Fig. 1, when the value of x = 0.0 was compensated, it revealed uniformity in the crystalline structure and the formation of distinct peaks. Additionally, the values of dhkl, which measure the separation between parallel planes (parallel surfaces), were computed through the application of Brick’s law of diffraction. Miller coefficients (h k l) were discovered using angles of reflection (2θ), and using the FullProf_Suite computer program13) and the results were verified through the software program-based Cohen’s least square method.14) The dimensions of the cell unit were calculated to be a = b ≠ c as shown in Table 1. These values support the tetragonal type of the crystal structure.15,16) When the compensation ratio of lead concentration (x) gets increased to 0.05, we observe that the diffraction values are sharper and have fewer broad bases than the pure sample (x = 0.0), which indicates further improvement in crystal structure and an increase in intensity but also reveals an increase in dimensionality (c).

when the lead content in the samples was increased from x = 0.0 to 0.05, 0.1 and 0.2. In the crystal structure, compensations for the compound play a more significant role. The value’s intensity and regularity rose with an increase in dimension (c) and a drop in (a, b), demonstrated both in Fig. 1 and Table 1.
Table 1.
displays the lattice characteristics a, c, c/a, and volume fraction V1223ph, critical temperatures Tc(offset), Tc(onset), and volume of mass (V) for samples of Hg1-xPbxBa2Ca1.8Mg0.2Cu3O8+δ for various lead contents (x = 0.0, 0.05, 0.10, and 0.20).
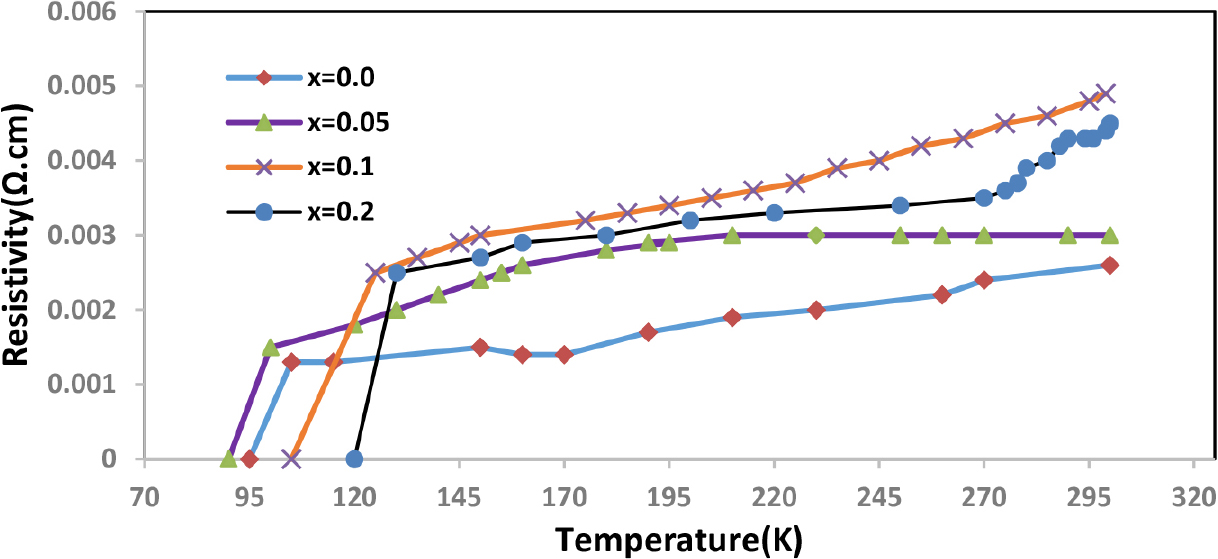
3.2. The electrical characteristics
The electrical characteristics of the Hg1-xPbxBa2Ca1.8Mg0.2Cu3O8+δ compound were investigated using different amounts of (x) as the values of x = 0.0, 0.05, 0.10, and 0.20 as shown in Fig. 2. This figure illustrates that all samples taken from the compound exhibit ohmic behavior, meaning that as the temperature drops, so does the electrical resistance.16,17) Additionally, it should be noted that all samples of the compound exhibit an increase in electrical resistance as the concentration of lead rises. The study has shown that for the prepared samples, the zero critical temperature Tc(offset) fell from 102 to 96 K and the onset critical temperature Tc(onset) fell from 108 to 101 K as the compensation ratio rose from x = 0.00 to x = 0.05. This is due to the small change in the number of substituted atoms. If the concentration of lead increases, the critical temperature Tc(offset) rises to 107 K, and Tc(onset) becomes 114 K, when the compensation ratio is adjusted to x = 0.10. When the lead concentration is increased to x = 0.20, the critical temperature of the compound rises to 119 K. The reason for these results is that the molecule played a perfect part in the crystalline structure. As seen in the Table 1, this proportion of replacement caused the percentage of oxygen to rise as the concentration rose. This, in turn, caused the critical temperature to rise. These findings are in line with other studies18,19) and can be explained by the high and good regularity in the crystal structure of the electrical superconducting compound. The volume fractional drop from 73 to 71 % when the amount of lead in the samples grew from x = 0.0 to 0.05, which is another factor contributing to the rise in critical temperatures brought on by the preference for the high phase 1223 over the other phases 1212 and 1201.20,21) The ratio of parameters c/a was calculated and recorded in Table 1, where it is generally observed that this ratio increases with increasing lead concentration. ΔTc was calculated from the difference between critical temperatures Tc(offset) and Tc(onset).
3.3. Microscopic results of atomic forces
With the use of an Atomic Forces Microscopic (AFM) instrument, the surface morphology of Hg1-xPbxBa2Ca1.8Mg0.2Cu3O8+δ with various lead (x = 0.0, 0.05, 0.10, and 0.20) was photographed, where observed from AFM pictures of this compound and for varied lead concentration the values of the average diameter band detected in 3D and surface roughness in 2D are given in Fig. 3. The values of the samples’ average diameter and surface roughness are shown in Table 2, which reveals that the surfaces of the samples have great homogeneity and good crystalline uniformity. Because of the homogeneity of the particles at high densities, the smallness of these values denotes the smoothness of the surface.22,23) It should be noticed that the photographs clearly show the impact of increasing the lead concentration. A horizontal crystal evolution takes place when the average diameter increases while the surface roughness, square root, and mean diameter decrease, which lessens crystal defects.24,25) A vertical crystal evolution takes place when the surface roughness, square root, and mean diameter increase. Studies have shown that the progression is parallel in the cases of low surface roughness, square root, and mean diameter.24,26)

Table 2.
Lists the average diameter and surface roughness in two dimensions for Hg1-xPbxBa2Ca1.8Mg0.2Cu3O8+δ compound with x = 0.0, 0.05, 0.10, and 0.20.
| x | Average roughness (nm) | Average diameter (nm) | Root mean square (RMS) (nm) |
| 0.0 | 1.532 | 134.63 | 0.638 |
| 0.05 | 14.00 | 78.48 | 18.32 |
| 0.10 | 3.18 | 106.34 | 3.88 |
| 0.20 | 12.6 | 78.09 | 16.02 |
Through the results of the structural characteristics presented, we conclude that the partial replacement of mercury with lead led to a change in all parameters of the crystal lattice through a change in the three lattice axes a, b, and c, which led to a change in the resistivity r, critical temperatures Tc(offset) and Tc(onset), as well as the size of the lattice and the proportion of phases. The reason for this is the difference in the sizes of the mercury and lead atoms, while the crystalline structure remains the same, ensuring that all samples have a tetragonal structure.
The results of electrical resistivity showed that all samples have a contagious behavior, as the resistivity decreases with decreasing temperature. The zero critical temperature decreased from 102 K to 96 K when the lead concentration increased from x = 0.0 to 0.05, while it increased from 107 to 119 K when the values of x = 0.10 to 0.20 increased. This indicates that the lead element has increased superconducting properties.
The AFM results of the samples also showed great homogeneity and good crystalline regularity during the partial replacement of mercury with lead. The surfaces of the samples have great particle homogeneity at high densities, which reduces crystalline defects. The results also showed that progress is parallel in cases of low surface roughness, root mean square, and average diameter.
4. Conclusion
In this study, samples of the chemical Hg1-xPbxBa2Ca1.8Mg0.2Cu3O8+δ with a range of x concentrations (x = 0.0, 0.05, 0.10, and 0.20) were synthesized using a solid-state reaction approach. The electrical resistivity was calculated as a function of temperature, and the results showed that all samples have a contagious behavior, as the resistivity decreases with decreasing temperature. The critical temperature decreases from 102 K to 96 K when lead concentration increases from x = 0.0 to 0.05 and increases from 107 to 119 K as the x values increase from x = 0.10 to 0.20. The structural properties of the samples were examined using X-ray diffraction measurements. Analysis of the X-ray diffraction data shows that the crystal structure of all manufactured samples is tetragonal, it was noted that all parameters of the crystal lattice and phase ratio were affected by an increase in the lead concentration value. The AFM results of the samples also showed significant homogeneity and good crystalline uniformity during the partial replacement of mercury with lead.
